DFP Broker Segmentation
My Role
Senior Product Designer
October 2019 - Present
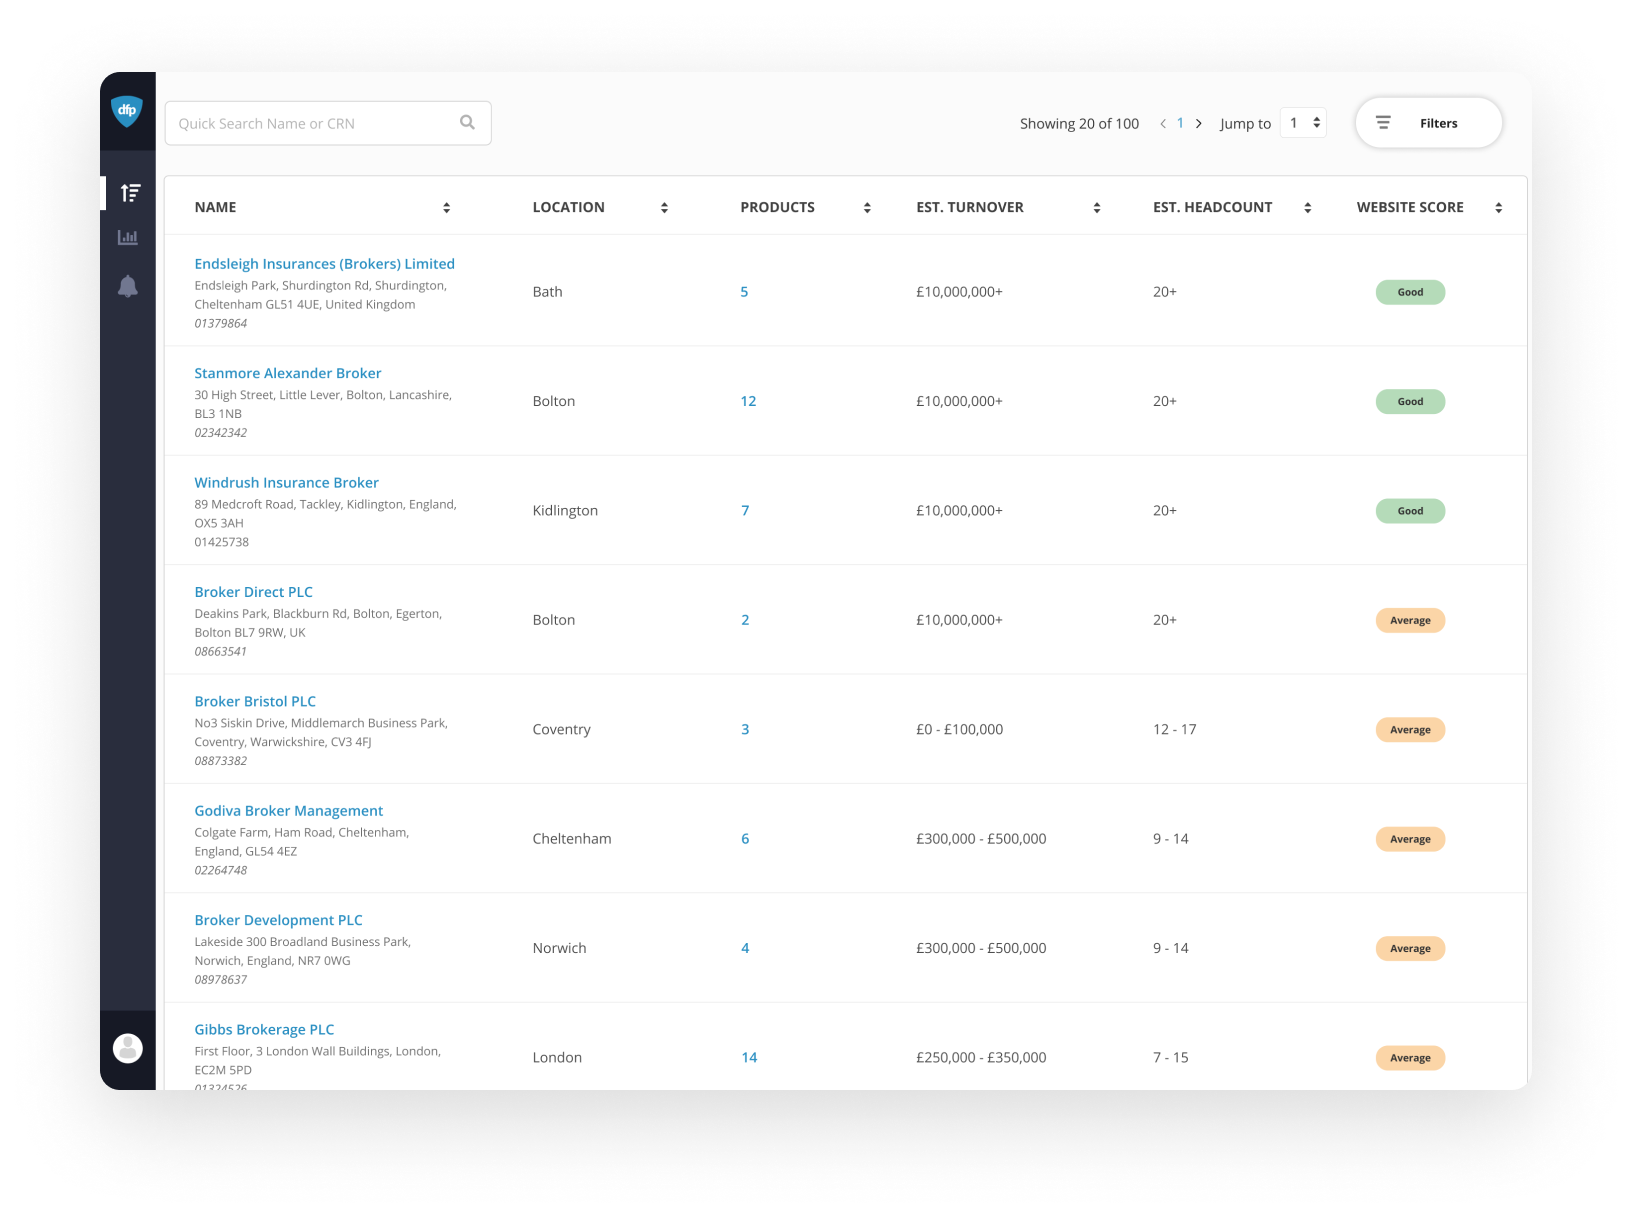
I was tasked to create a portal where Brokers could sort their large list of brokers by name, location, specific products, turnover, headcount and website score. The data for these lists are pre-populated and stored in our ‘Data Warehouse’, and pulled up when the user logs in to the Risk Atlas. The challenge with this project was to create a tool not too dissimilar to the way Excel works, but which had 100% tailored filters based on the need of the individual Broker clients.
Sketching from the Off
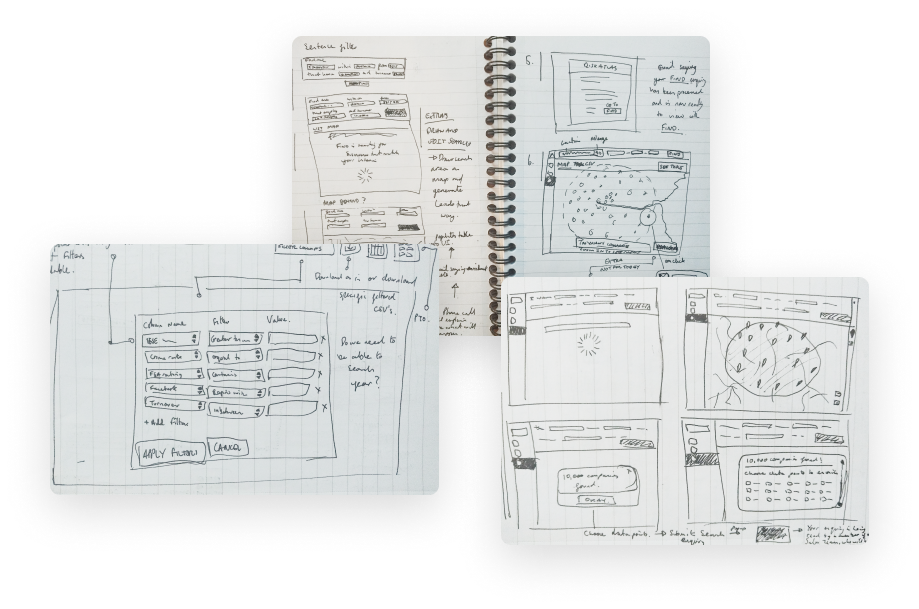
Lo-fi sketches
After interviewing the sales team, who had introduced the idea of the Broker Segmentation product off the back of sales discussions with brokers, I decide I had enough information and external validation to start sketching my ideas - the deadline on this project was tight and needed to be turned over quickly. This was less of a ground up project than the DFP Risk Atlas, as the ‘Data Warehouse’ was now built and in action.
Focus on Prototyping
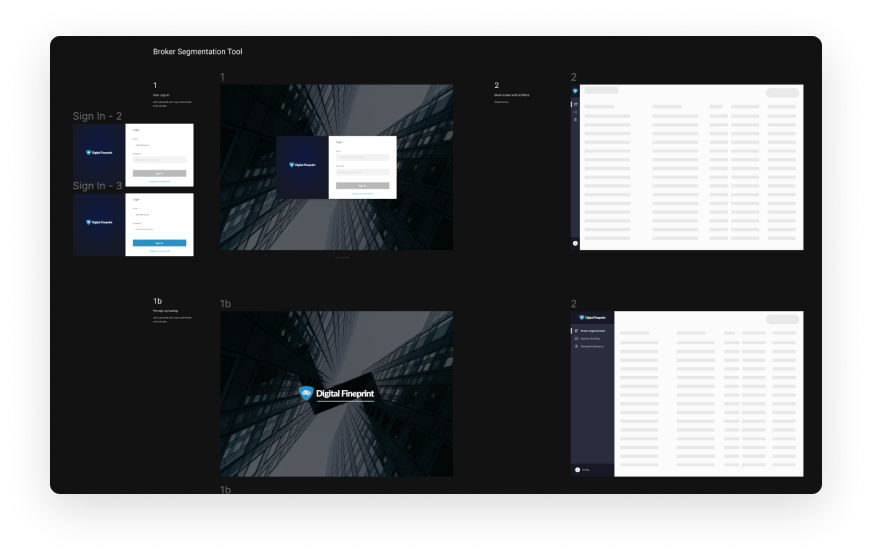
Creating an Organised Artboard
The main focus for this project was to create a high fidelity prototype, and quickly, so the sales team could take it away and show clients. The easiest way to create a prototype with speed is to have a well organised and signposted artboard.
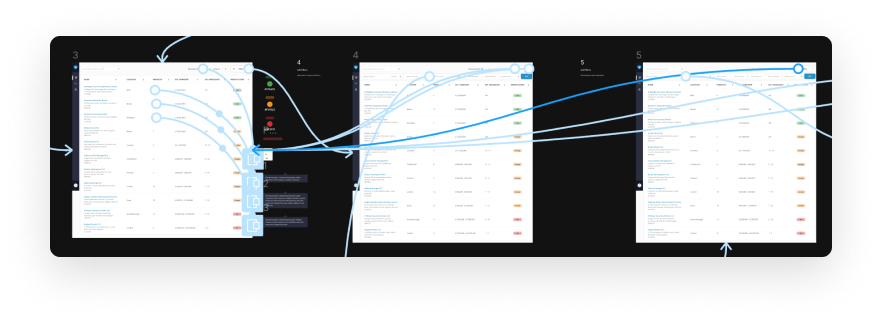
Hooking up the Prototype
As this project revolved around table behaviour, I focussed on the ease of use of the filters, and stress-tested them with users in the office so I could see where the flaws were.
For this project, because we didn’t have the time to carry out extensive, external user research, so I set up weekly QA meetings with the front-end developer to iron out any kinks in his or my work, to make the handover to sales as smooth as possible.
This work led to a suite of tools being built for DFP, ultimately ending in an exit to Hubb.