DFP Risk Atlas
DFP Risk Atlas provides Insurance Underwriters and Account Managers a range of data insights - both open source and third party - on small to medium businesses, to help them better understand the risks those businesses face.

My Role
Senior Product Designer
November 2018 - Present
I was tasked with creating a new dashboard suite from scratch for the insurance industry. I spent four weeks sketching ideas and having meetings with the CEO of DFP and other key stakeholders before I started to create basic wireframes on Photoshop and InVision (I soon exported everything to Figma.) Three potential use cases were chosen, and these were the three I was to investigate and ultimately design for: Underwriters, Operations Managers and Marketing & Sales.
Understanding the User
Creating User Profiles
I started off by creating user profiles of various jobs in the insurance industry. As insurance was a field I had no prior experience in, I interviewed the relevant members of Digital Fineprint who used to be Underwriters, and asked Sales for help beefing out the profiles.

User Interview Flow
I used Confluence to create this user interview flow in order to include all key stakeholders in my process. This led to transparency across the business, and many internal meetings discussing next steps and relevant candidates for me to interview.
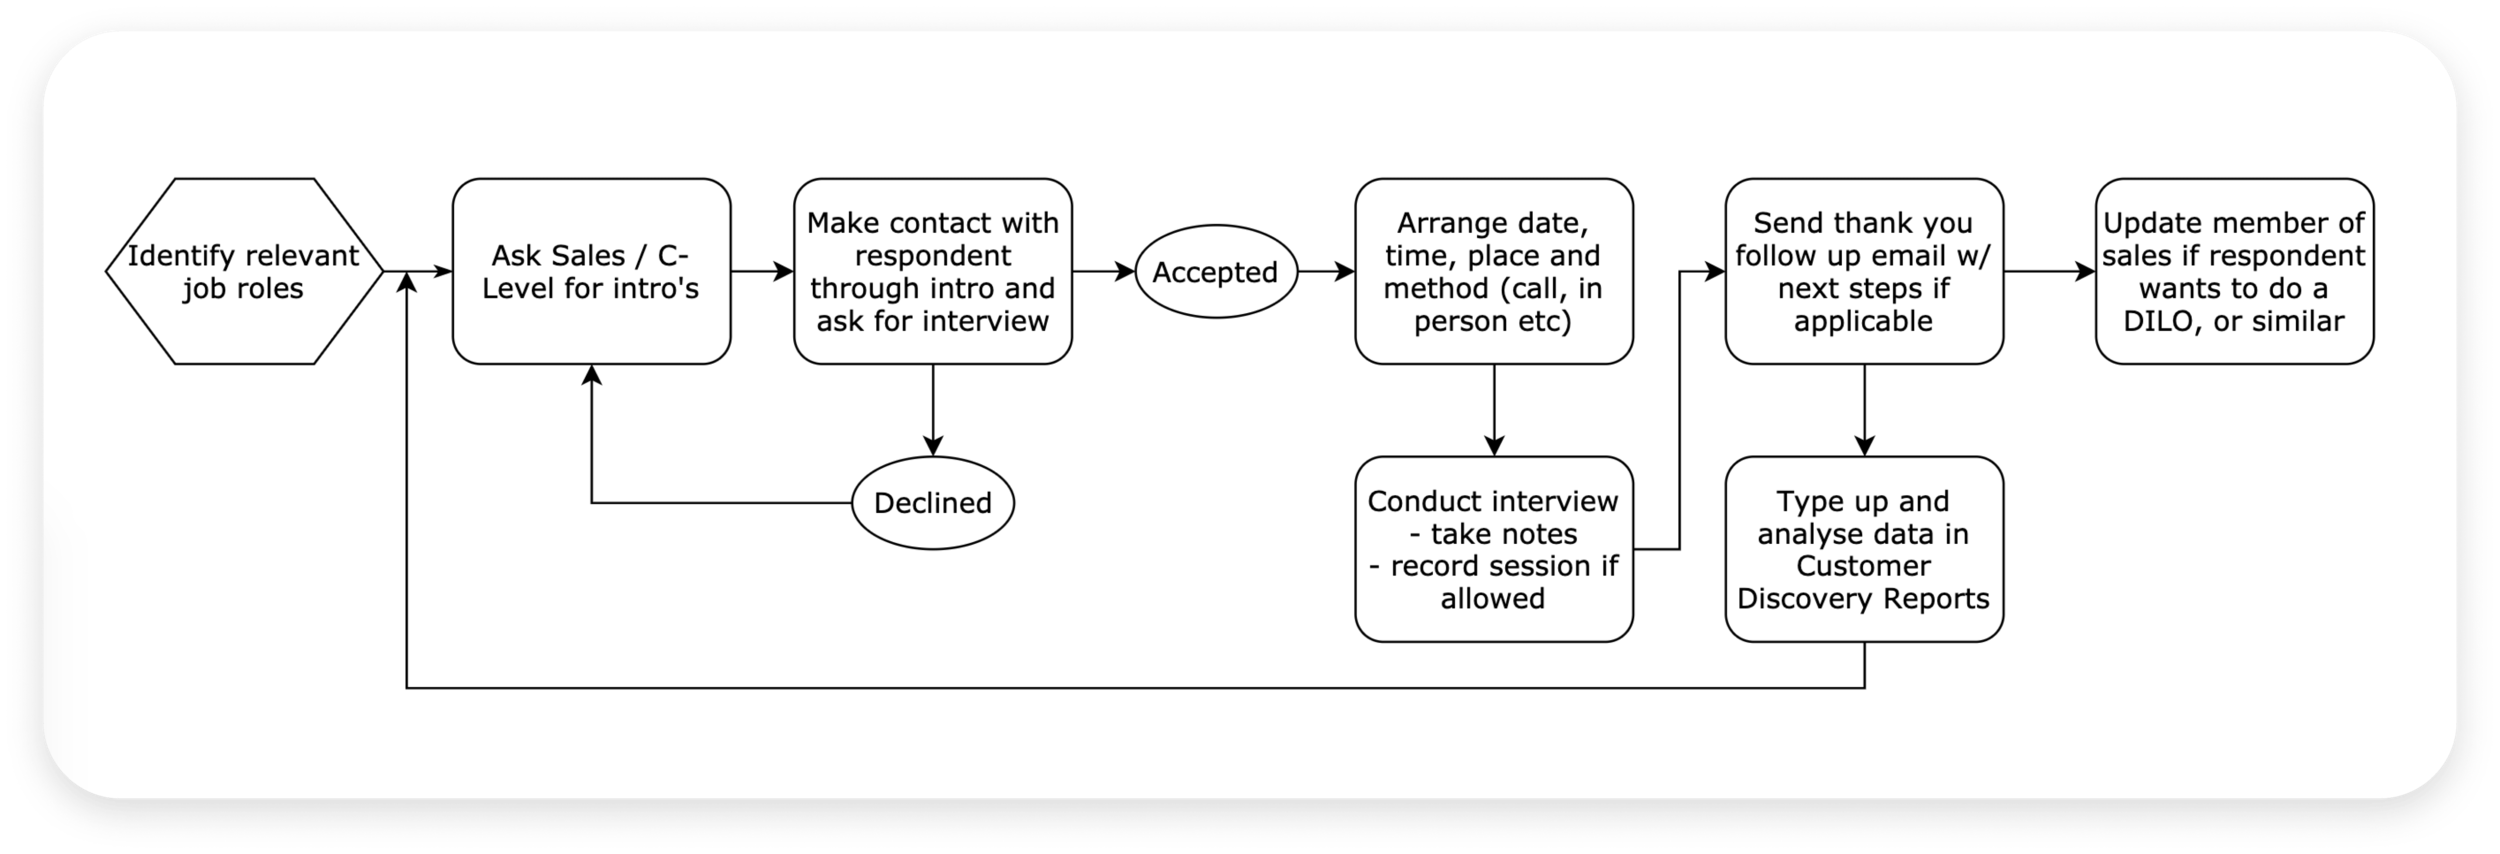
I created an overview of what Customer Discovery Conversations are so that others in the sales team could pick up the task and interview their own candidates when necessary. Attached to this page was a cue sheet I designed to keep the conversation neutral, and allow the interviewer to ask open ended questions.


Before I started interviewing, I made a Trello board dedicated to the research, so I could arrange the high volume of interviews I was to conduct. I filtered the cards into the columns: Declined, Contract List, Contacted, Negotiating, Confirmed, Conducted, Documents. Below is an image of what the board looked like towards the end of the research phase.

Research Results
Creating Common Themes
Using the glass wall, I collated all of the responses and wrote them on post-it notes. I then grouped them into common themes so I could start to validate (or invalidate) the ideas I was coming up with for the DFP Risk Atlas. I could also use the themes to focus in on what customers found most important

I then transferred this data to Confluence, where I created an in depth matrix of job role, theme and who said what. I created a high level matrix, so I could identify what themes were common across the three use cases the company had identified as potential routes. The most common daily gripes revolved around Data Availability, Data Access, Process Efficiency and Data Quality.


The Lo-fi sketches
Sketching the Elements
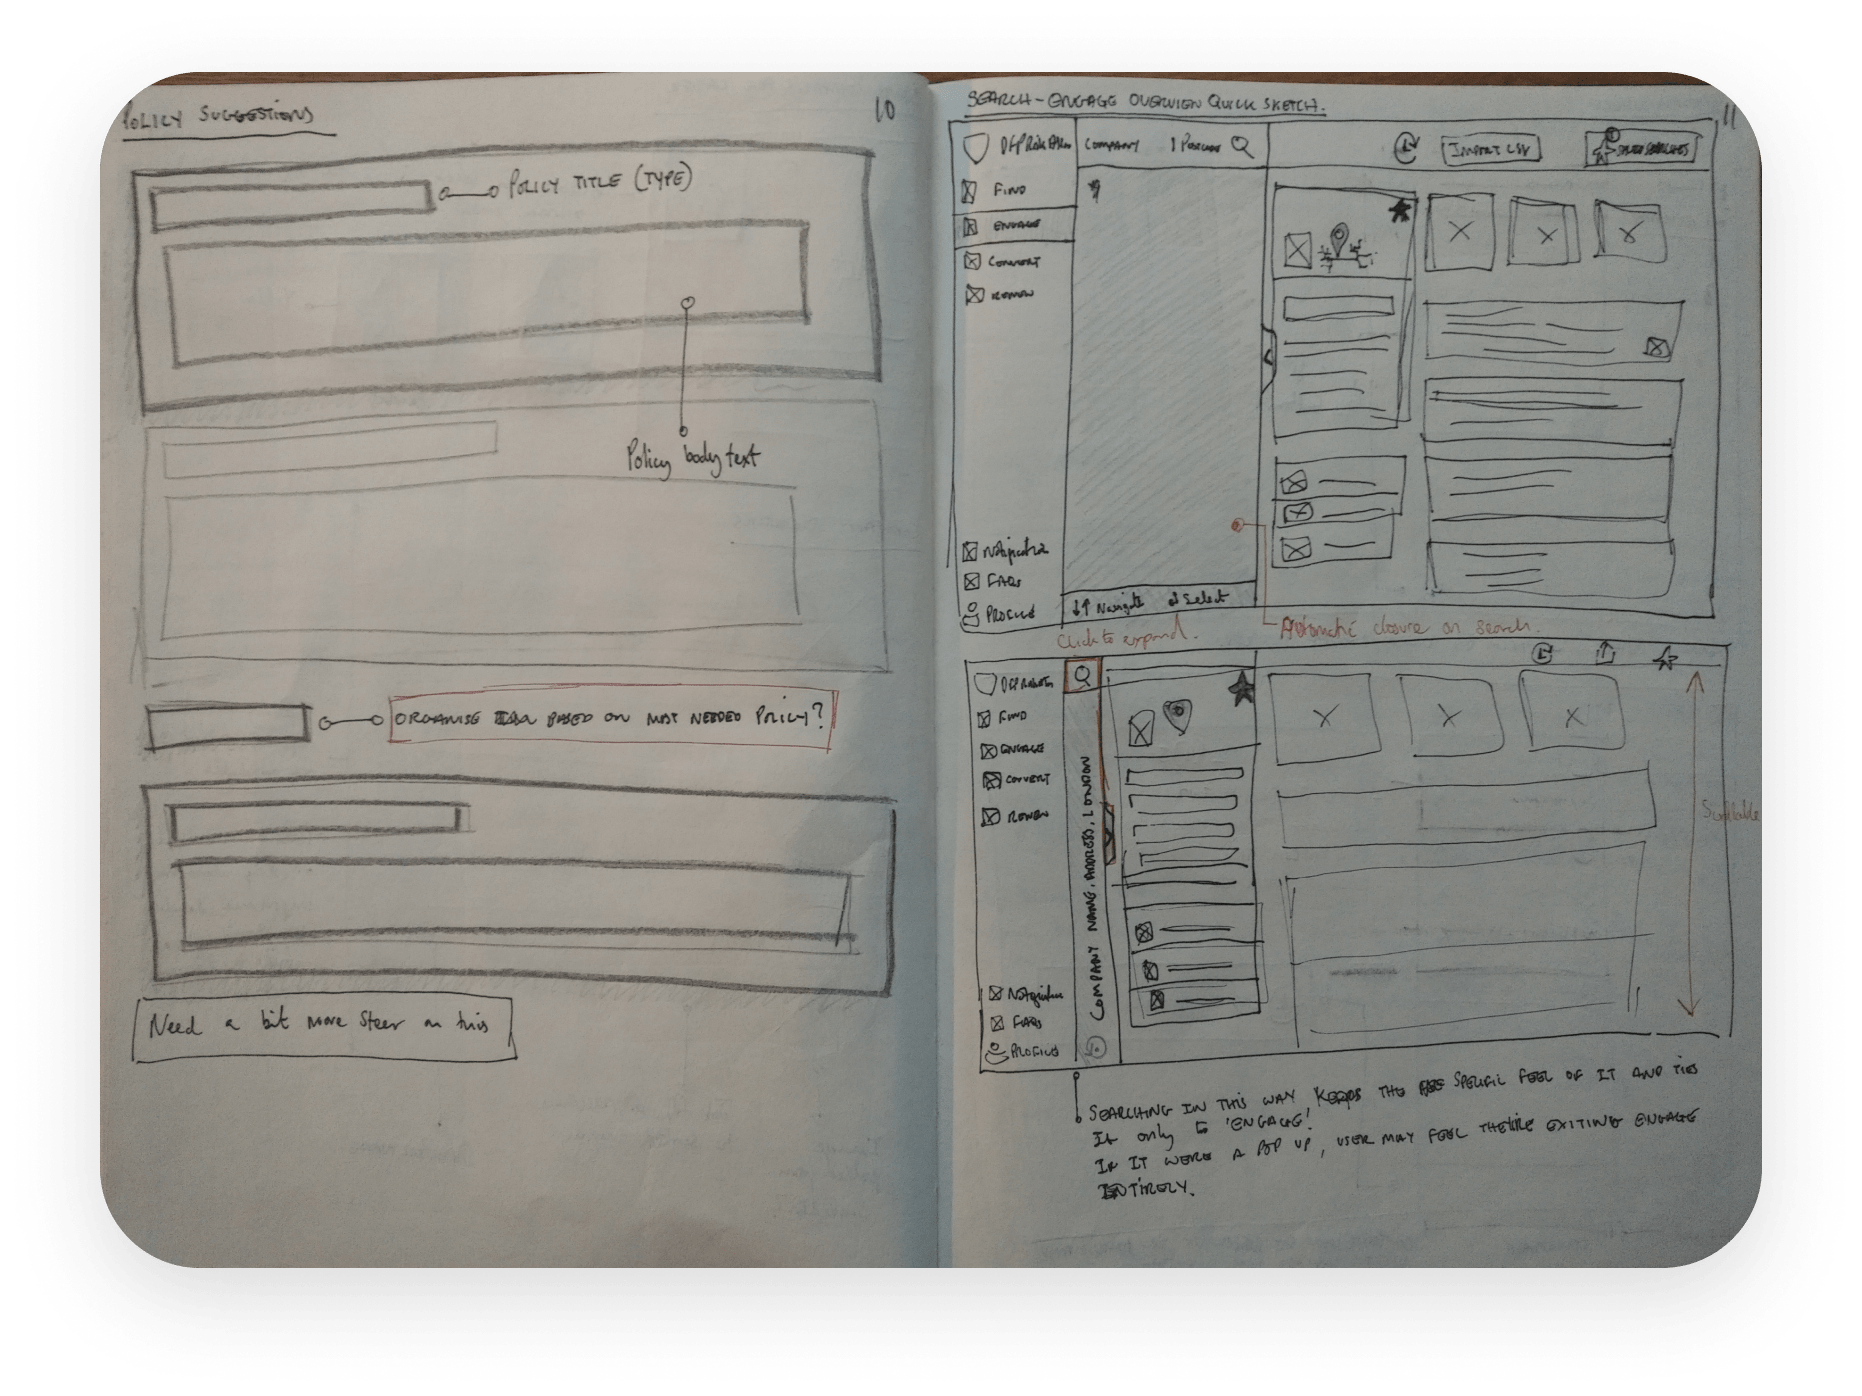
After collecting all of the necessary initial research, I began to sketch out the elements for the product in my sketch pad. The idea was to segment the data into the groups important to the end user. At this stage, I designed the product for Account Managers and Underwriters, whose primary job it is to find and analyse data on businesses. I wanted to give priority of position to the general company information: name, company number, social links, address or number of addresses.

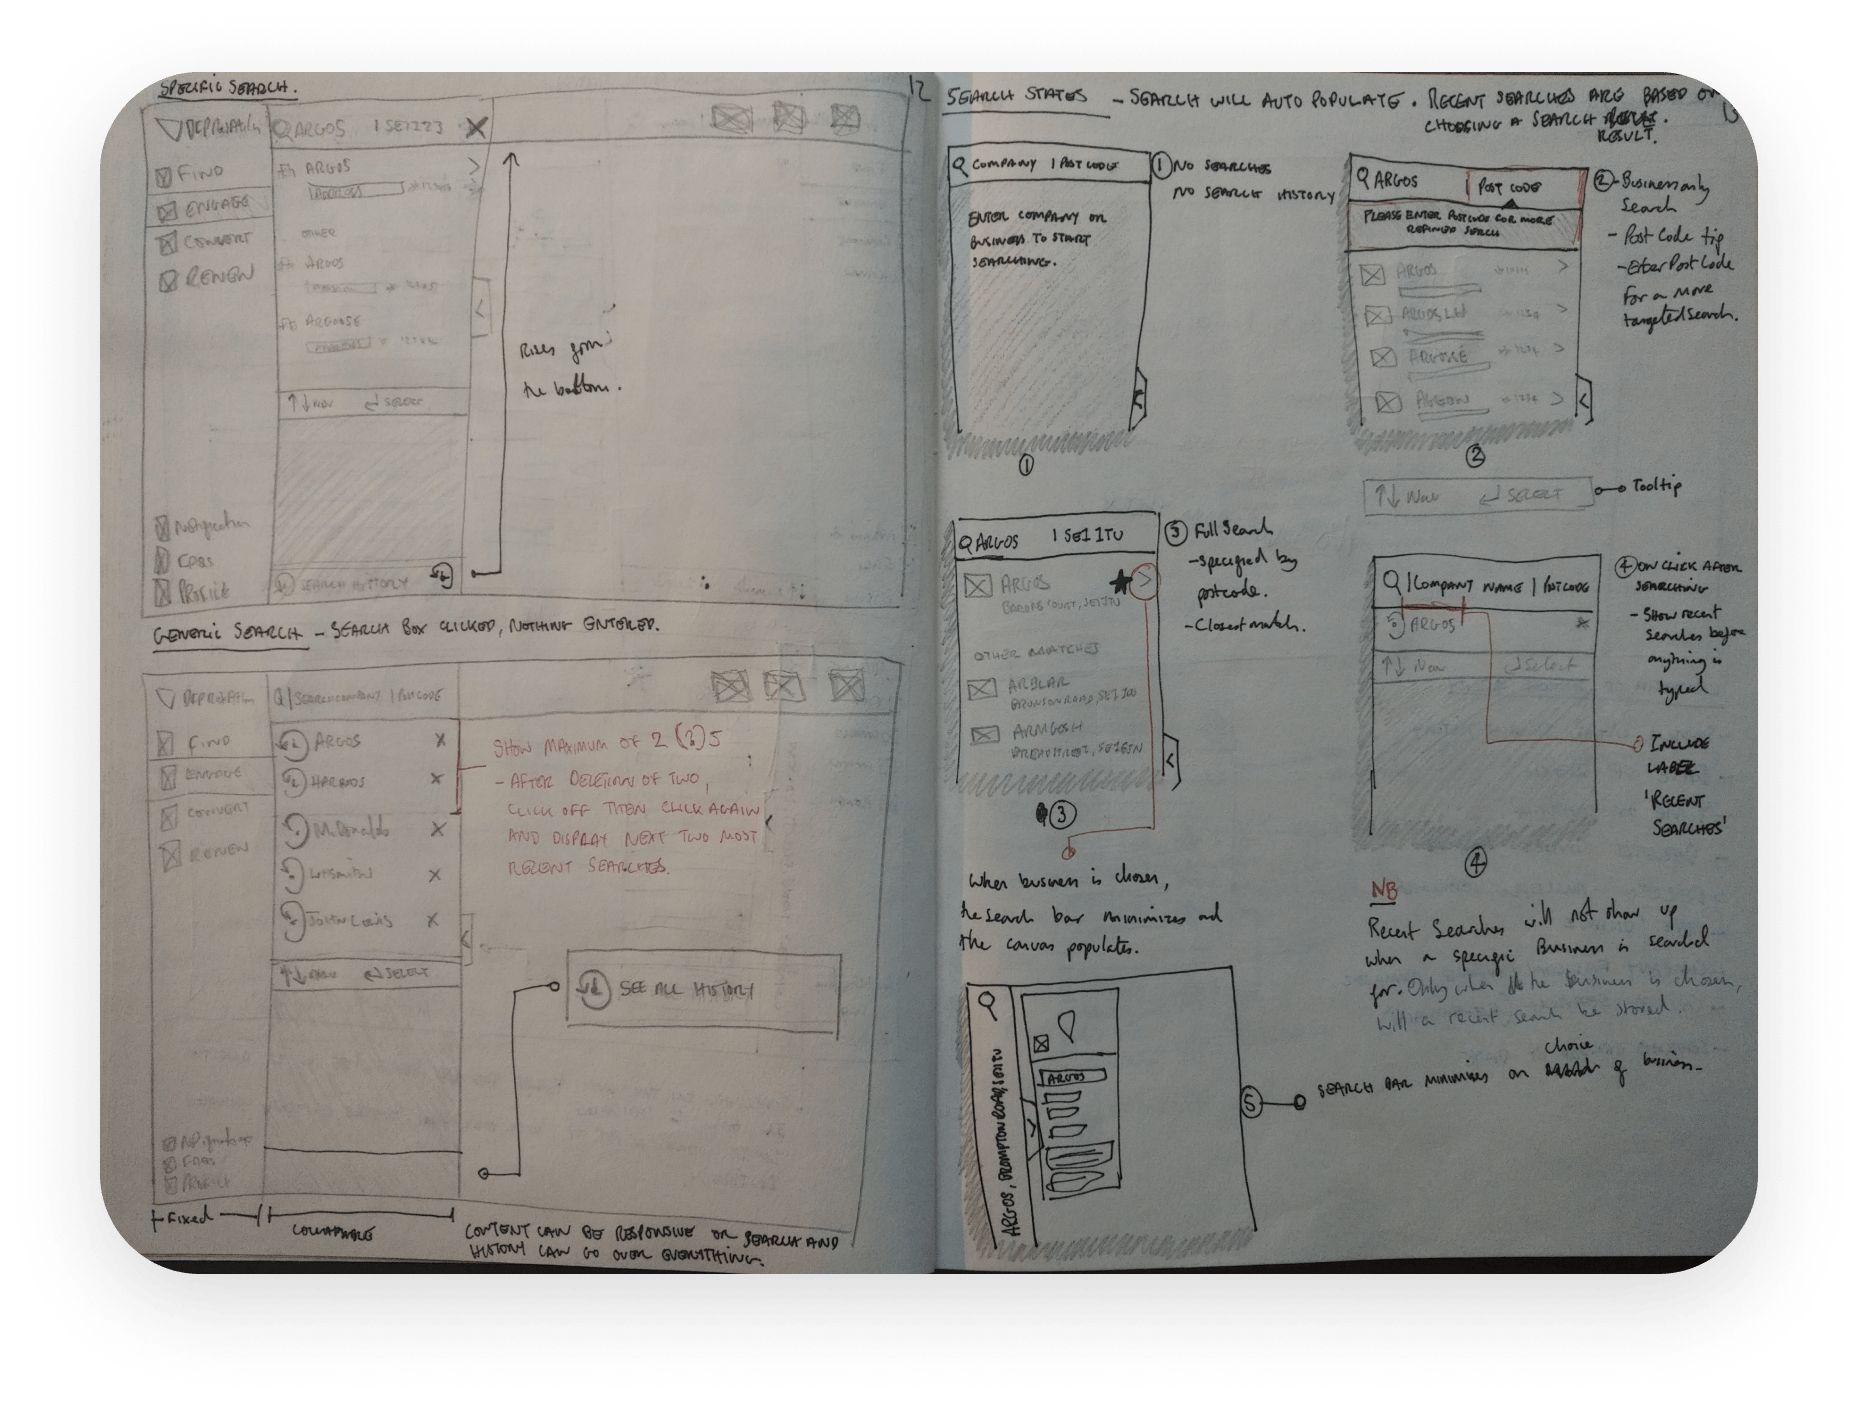
I then sketched the next most important elements - the search bar which included Company Name and Post Code. And then the tiles which displayed Gross Profit, Employee Size and Company Turnover. Data Transparency is a big issue for underwriters, so I decided to sketch a banner letting the user know if the figure shown was the actual figure (pulled from Companies House) or predicted (using data models created by the data science team.)

Next, I sketched the remaining elements from a high level, making sure I covered the side bars and where the information would fit in the product as a whole. Also featured is a basic profile view, more search results, suggested policies and mobile search view.

Bringing it to Life
Designing the UI Elements
With the sketches ready and signed off, I was then ready to start designing. I started the design process on Photoshop and Invision, but moved to Figma, and found I could design and prototype in tandem, and so speeding up my process. I was also able to seamlessly share my designs with the CEO, CPO and CTO.

I created a material design board on Figma and started to build out the UI elements as the development team built the product. I included mobile designs for future use, though the product is not ready to be built as a native mobile app yet. The marketing team used the newly created board as a sort of Brand Guideline for their collateral.

Designing the Product
I designed all of the key products in one go, and then I split them up into smaller pages so they could be included in the engineering sprints. Below is an example of the home screen of the Engage product, which has since been renamed as Business Profiling.

I made sure to design to grids so the screens would be flexible on different screen sizes. This helped the engineering team grasp what would happen to the product at different break points.

Creating and Managing Sprints
I then built out the product by splitting up each individual element into its own Figma screen. I matched the name of the screen with the tickets in JIRA, and worked closely with the Lead Engineer in order to explain my design decisions to his team. I also gave several Show & Tells to the company to explain the various stages of design, and also gave a lesson on how to utilise Figma to each individual team.

The DFP Risk Atlas suite is still being built, and isn’t currently available to the public.
Management
Managing Summer Interns
In July 2019 I took charge of a small team of summer interns. These included one Designer, one Project Manager and an Engineer. I worked closely with the Project Manager and Designer, and taught them how to use JIRA, Figma and Trello together to better manage their time. I held workshops for Laura - the designer - in Figma, and Safwaan - the project manager - I taught the ins and outs of JIRA. Each of them came to me individually with problems they encountered, both professional and personal, and I did my best to help them handle the pressures of quick deadlines and an agile work environment. I loved working with this small team, and was amazed at how much they were able to learn in the four months they were with us.